OBSERVATIONS
- Markets were lower last week with the S&P 500 losing 0.3%, while small caps (Russell 2000) lost 0.6% and the yield on the 10-year Treasury was little changed and ended the week up 5 basis points to 4.18%.[1]
- New home sales surged by 20.5% month-over-month in August to 800k (annualized rated) from July’s 664k rate, which itself was revised higher.[1]
- Existing home sales were essentially flat in August—falling 0.2% month-over-month—to 4.0 million (annualized rate). For the first 8 months of the year, existing home sales in total are down 1.2% compared to the first eight months of 2024.[1]
- The final estimate of Q2 real GDP growth was revised up to 3.8% from the previous estimate of 3.3% largely due to an upward revision to consumer spending.[1]
- The Fed’s preferred inflation gauge, the PCE price index, showed that headline prices inched up in August to 2.7% year-over-year (YoY) from July’ 2.6% YoY figure, while core-PCE—which removes the volatile food and energy categories—was unchanged in August from July at 2.9% YoY.[1]
- Initial unemployment claims remain low and fell to 218k last week, which was a decline of 14k from the week prior and on-par with the number of initial claims filed the same week last year.[1]
EXPECTATIONS
- After a bevy of Fed officials speaking last week, markets only modestly adjusted their expectations for Fed action in Q4. Markets are still pricing in about a 90% chance of a 25 basis point cut in October, but their expectation for an additional 25 basis point cut in December has fallen from nearly 75% at the beginning of the week to only 60% as of last Friday.[1]
ONE MORE THOUGHT: Record Highs and Positive Momentum[1]
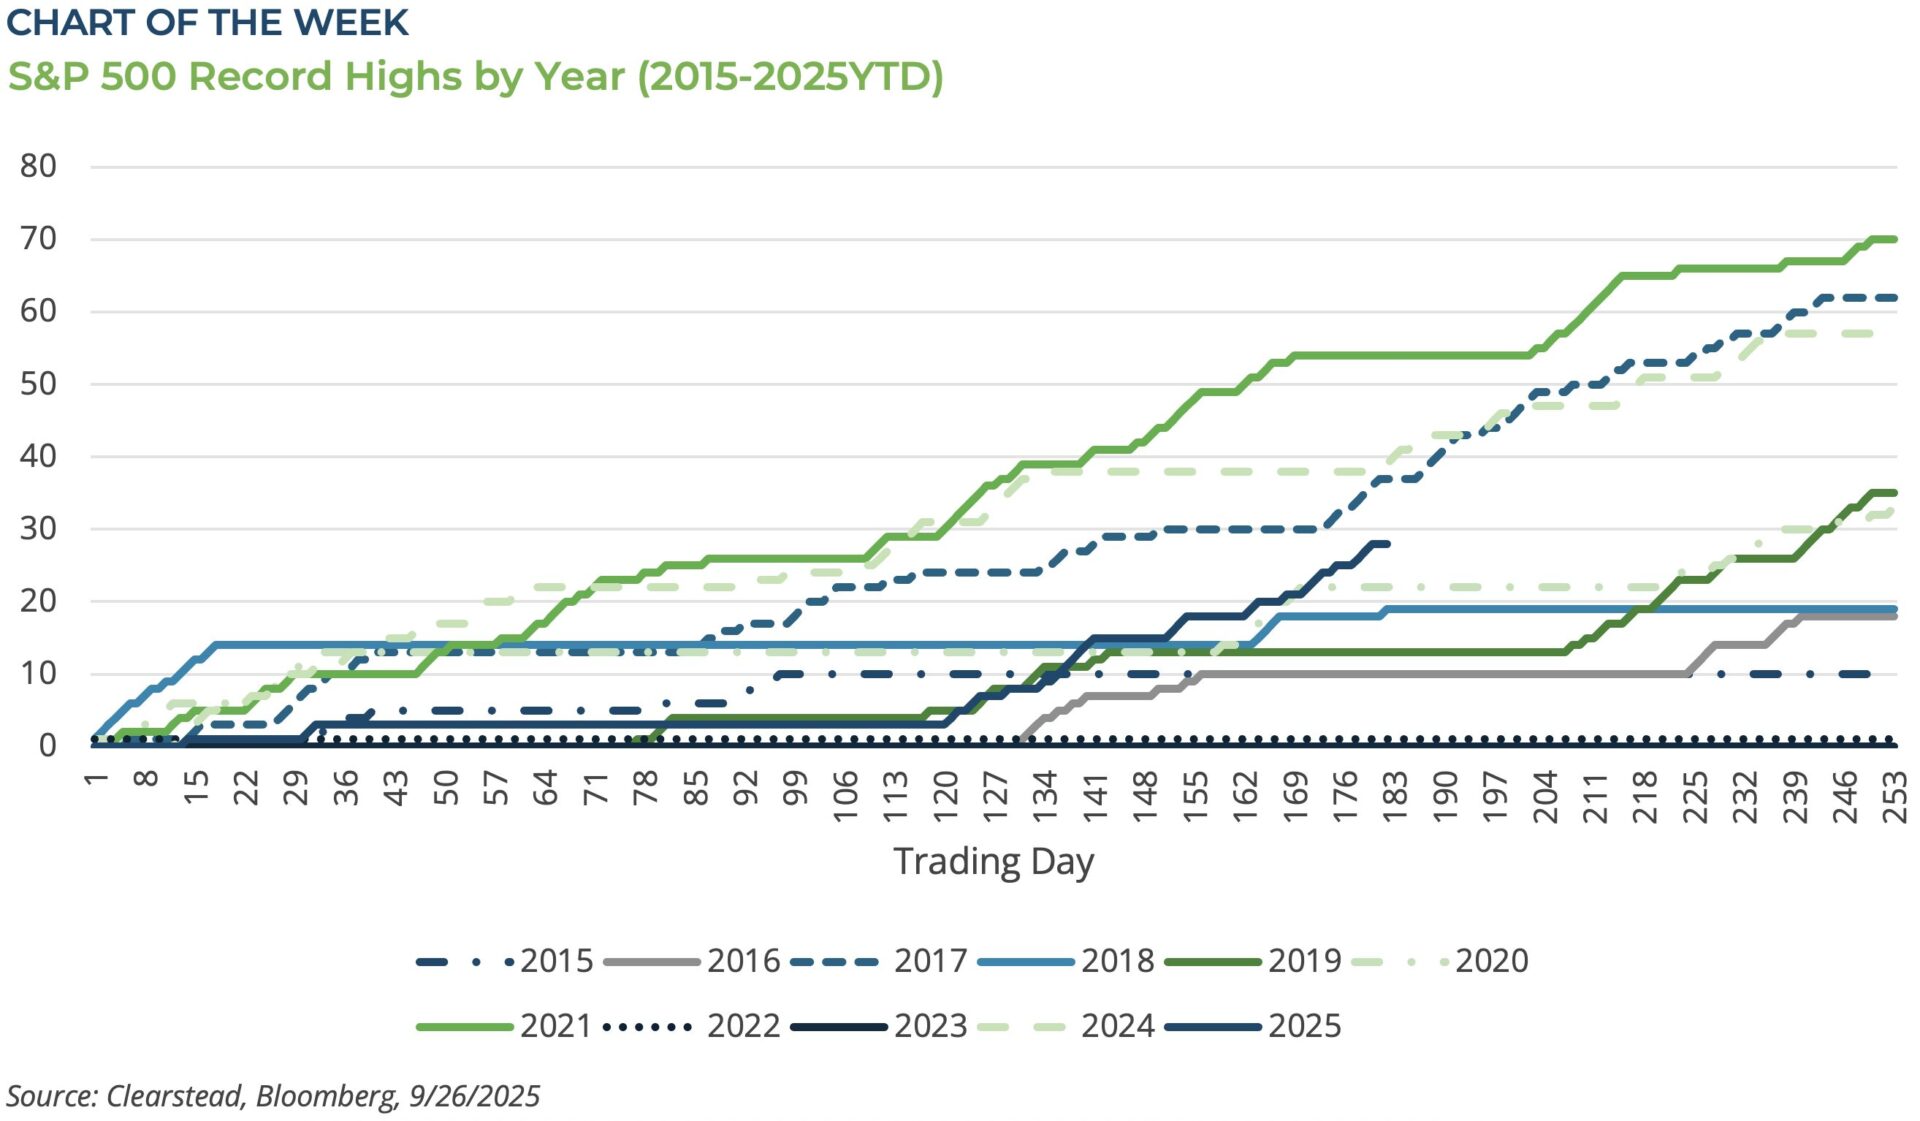
As we close out September as well as Q3-2025, it is worth noting just how much positive sentiment and momentum is present in the markets. Typically, September is a tricky month for markets to navigate and nearly 50% of Septembers since 1945 have featured negative returns. But not this year. In September alone, the S&P 500 hit eight separate record highs and closed higher in 11 of 19 trading days so far. Similarly, measures of investor sentiment have shown lots of positivity. The weekly Bull-Bear survey has been above its 5-year average for most of the month suggesting many retail investors have a positive outlook on stocks. Other measures, such as the VIX—the so-called fear gauge—remains below its long-run average throughout September. Another common measure of sentiment is the put-call ratio which can be seen as a proxy for how much optimism is in the market and it also suggests that most investors are not very worried about the downside risk to the market. Another measure of investor risk appetite can be seen in the low spreads in investment-grade corporate bonds—Bloomberg Investment Grade Corporate Bond Index shows the difference in the yield between a treasury and investment grade corporate bond of the same maturity—which hit a 27-year low in September. Here at Clearstead, we are less sure the market is adequately balancing the upside and downside risks present in the market today. One may recall that in 2018—in the first Trump administration—the market traded higher through the first nine months of the year and hit 20 separate record highs (see Chart of the Week). While the S&P 500 ended September 2018 up over 10%, it then shed nearly 20% in Q4-2018 and ended the year (2018) with a negative 4.4% return. Reversals of momentum can be abrupt and with the valuations of the S&P 500 stretched as they currently are—the S&P 500 is trading about 24.5x CY2025 earnings and nearly 23x the next 12-month forward earnings—there is little margin for error. Now there are also real differences with today’s environment and 2018. For one, the Fed in 2018 was hiking rates and seeking to restrict economic activity. At present, while Fed action in the final months is not fully clear, monetary policy is likely to become incrementally less restrictive as we close out 2025 and head into 2026. Another big difference between 2018 and today are the earnings and capex spending related to the Artificial Intelligence sector. The AI ecosystem buildout—AI models, datacenters, and new power generation—may provide a structural uplift to productivity and is a major driver of the US economy at present. So far, we have been pleasantly surprised by the strong up-draft in US equity markets over the past several weeks, and we are also generally optimistic about the prospects for markets in 2026. Nonetheless, we would not be surprised if some volatility creeps back into the markets in the coming weeks. But today’s volatility often sets the stage for tomorrow’s gains, and patient investors should always remain focused on their long-term goals rather than short-term noise.

[1] Bloomberg LP, 9/26/2025
Information provided in this article is general in nature, is provided for informational purposes only, and should not be construed as investment advice. These materials do not constitute an offer or recommendation to buy or sell securities. The views expressed by the author are based upon the data available at the time the article was written. Any such views are subject to change at any time based on market or other conditions. Clearstead disclaims any liability for any direct or incidental loss incurred by applying any of the information in this article. All investment decisions must be evaluated as to whether it is consistent with your investment objectives, risk tolerance, and financial situation. You should consult with an investment professional before making any investment decision. Performance data shown represents past performance. Past performance is not an indicator of future results. Current performance data may be lower or higher than the performance data presented. Performance data is represented by indices, which cannot be invested in directly.
Related or Tagged New Posts

market perspectives
September 22nd 2025
Research Corner | 9/22/2025
market perspectives
September 15th 2025
Research Corner | 9/15/2025
market perspectives
September 8th 2025
Research Corner | 9/8/2025
market perspectives
September 2nd 2025
Research Corner | 9/2/2025
market perspectives
August 25th 2025
Research Corner | 8/25/2025
market perspectives
August 18th 2025
Research Corner | 8/18/2025
market perspectives
August 11th 2025
Research Corner | 8/11/2025
market perspectives
August 4th 2025
Research Corner | 8/4/2025
market perspectives
July 28th 2025
Research Corner | 7/28/2025
market perspectives
July 21st 2025
Research Corner | 7/21/2025
market perspectives
July 14th 2025
Research Corner | 7/14/2025

market perspectives
July 10th 2025
Quarterly Market Insights | 2Q25