May 5th, 2021
By Aneet Deshpande, CFA, Chief Investment Strategist and Dan Meges, Managing Director of Equity
THE FISCAL RESPONSE TO THE PANDEMIC
The federal government has now spent $5.2tn in stimulus in order to support and stimulate the U.S. economy. In 2020, the $2.4tn CARES Act was passed along with an additional $900bn by way of the COVID-19 Relief bill. Meanwhile, in 2021 we have seen an additional $1.9tn in spending measures passed through the American Rescue Plan. But now politicians have opened a debate over a proposed $2.3tn infrastructure package dubbed the American Jobs Plan. Additionally, President Biden has laid out an additional $1.8tn social plan, named the American Families Plan. Taken together all this new fiscal spending would amount to about 44% of 2019 GDP.
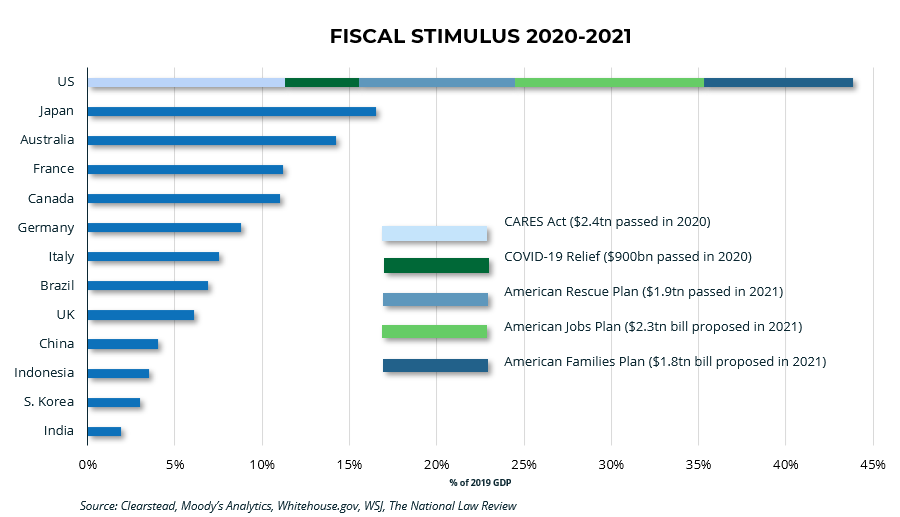
It remains to be seen how much of President Biden’s aspirational $2.3tn infrastructure package and $1.8tn social plan ultimately becomes law. Regardless, rising taxes are perhaps a forgone conclusion. The previously passed spending measures ($5.2tn) are best characterized as deficit spending and any new stimulus proposals are likely to be tied to changes to tax policy to fund said proposals. The proposed $2.3tn American Jobs Plan is expected to be funded through a series of tax changes (primarily by lifting the corporate tax rate) implemented by the proposed Made in America Tax Plan, which is estimated to generate $2tn over a 15-year period. Meanwhile, the proposed $1.8tn American Families Plan is likely to be mostly funded through increases in capital gains and personal tax rates – both of which are likely to target the “wealthy”—largely being defined as those making more than $400,000 per year.
THE MARKET’S IMMEDIATE RESPONSE TO TAX HIKES
The immediate reaction to rising taxes may be to extrapolate the negative consequences of higher taxes. It goes without saying, at an individual level taxes matter and Clearstead will be working with clients closely to ensure any changes to tax policy can be integrated and optimized. At the corporate level, higher taxes are thought of as leading to lower profits, lower earnings per share, and, therefore, lower stock prices. When, in truth, the relationship between rising taxes and stock prices is much more nuanced and may be partially offset by the stimulative impact of spending measures. For stocks, other considerations inherently play a role in the path of their returns, be that earnings growth, inflation, interest rates, federal reserve policy, profit margins, and valuations, to name a few. That said, the negative sentiment is easily understood; taxes are going up, markets are at all-time highs (more on this below), profit margins are high, valuations are high, short-term inflation expectations are rising, and interest rates are rising. On the flip side, earnings growth is strong, monetary policy is supportive, and fiscal policy remains (as we noted before) at levels unseen in history.
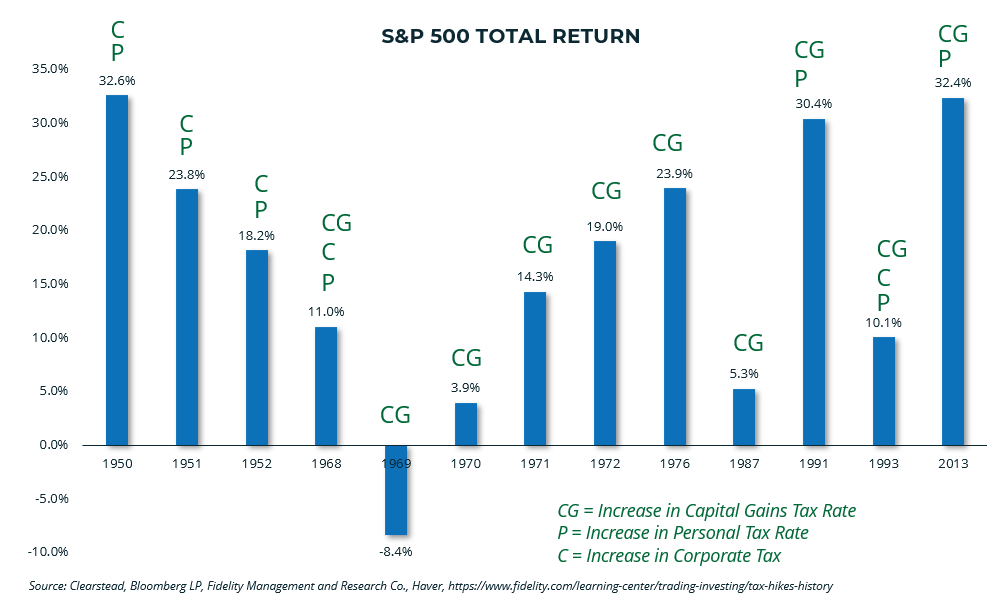
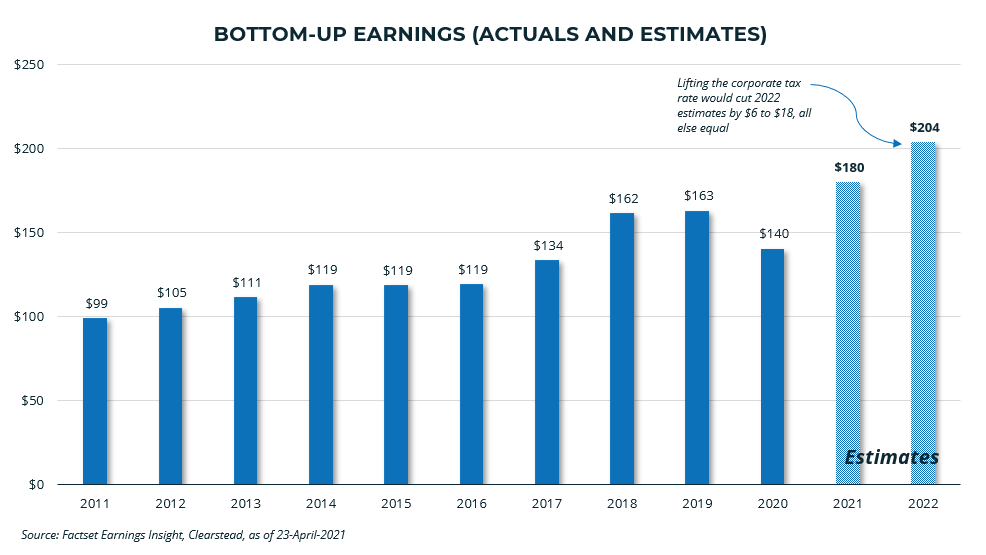
Focusing on taxes, since 1950, there have been thirteen prior instances where some combination of capital gains, personal taxes, or corporate taxes have been increased. Twelve of the thirteen years were associated with positive S&P 500 total returns and the average return during those thirteen years was 16.7%[1]. While this is just one perspective, we expect history could be a guide, at least for the near term. For now, corporate earnings continue to positively surprise and are expected to reach an all-time calendar year high of $180 per share for the S&P 500. For CY 2022, earnings are expected to reach nearly $204 per share for the S&P 500 not including any impact from corporate tax changes.[2] Preliminary estimates for 2022 earnings impact from corporate tax increases range in the 5-10% territory for the overall S&P 500.[3] Importantly, the impact on earnings is likely to be sector dependent and current estimates indicate that technology, consumer discretionary, and communication services sectors could be most at risk from corporate tax reform.[4]
Much needs to be sorted out in fiscal policy terms, and passage of even a fraction of the proposed $4.1tn in additional stimulus will require funding through increases in taxes.
As it relates to capital gains rates rising, the ultimate impact may not be completely negative on overall stock returns either. As an example, the tax reform of 1986 raised the capital gains tax from 20% to 28%, triggering a surge of selling as capital gains were being recognized in late 1986 prior to the new higher rate becoming effective in January 1987.[5] A similar phenomenon was seen in 2012 prior to the capital gains rate being raised in 2013.
The S&P 500 experienced a maximum drawdown of -9.4% in 1986 from 4-Sept to 29-Sept. While in 2012, the S&P 500’s maximum drawdown was -9.6% from 2-April to 1-June.[6]
Ultimately investors in both cases bought back into the public market in a greater capacity in the next quarter. Specifically, a Goldman Sachs analysis found that wealthy households sold about 1% of their equity exposures before the tax rate change only to buy back 4% equity exposure subsequently.[7]
A final point, and probably the most critical one, is that markets are at all-time highs, having gained +11.8% YTD[5] (as of 30-April); our expectations for the year were for modest gains in the mid to high single digit territory. With that in mind, we are of the mindset that broader equity markets are inching toward (if not already there) a point that John Mauldin[8] once described as being a ‘bug in search of a windshield’ (Mauldin was describing the Japanese economy in a book he co-wrote, though the analogy fits here). The catalyst for a healthy ‘correction’ in broader markets may well be related to taxes and, to be fair, it may be related to a host of other variables, such as a significant surprise in inflation. Invariably when that point comes for markets and a correction does happen, market watchers may well draw the link to the prospects of tax hikes. The reality is that markets go down for a variety of reasons and do so with regularity.
The S&P 500 declines -5% or more approximately three times per year, -10% or more about once a year, and -20% or more every six years.[9]Of note, the S&P 500 has not experienced a -5% decline since mid-October of 2020.[5] Also, declines of -20% or more have been generally associated with recessions. Since the Great Depression, the S&P 500 has declined more than -20% fourteen times. Eleven of those fourteen times were associated with recession while three did not occur near recession (1961,1966, and 1987) – so non recessionary -20% declines are possible, though not likely.[10]
The best course of action, in our view, is to maintain a disciplined asset allocation that is aligned with achieving your specific objectives (See our Blog series on the Hierarchy of Needs from last Spring). Additionally, rebalancing is a simple step one can take to ensure investment portfolios are not straying away from your long-term asset allocation – this helps to limit surprises when markets do get volatile. Lastly, we expect investment and tax planning opportunities to avail themselves in the event that volatility does return to markets.
Look for more from Clearstead as it relates to our thoughts on any potential tax reform.
[1] Clearstead, Bloomberg LP
[2] Factset Earnings Insight, 23-April-2021
[3] Estimates for 2022 S&P 500 EPS impact from corporate tax hikes: J.P. Morgan -4% decline, Goldman Sachs -3% to -9% decline, UBS -4% decline,
[4] https://www.marketwatch.com/story/heres-what-tax-hikes-could-mean-for-the-stock-market-as-biden-pushes-infrastructure-plan-11616790374, https://www.wsj.com/articles/the-stock-markets-leaders-appear-most-vulnerable-to-bidens-tax-plan-11601803801
[5] “The Potential Investment Impacts of Rising Individual Taxes” BoA/Merrill Lynch April-2021
[6] Bloomberg LP
[7] “Stocks Will Get Over Their Big Biden Tax Wobble” Bloomberg 23-April-2021
[8] “Endgame: The End of the Debt Supercycle and How it Changes Everything”, Mauldin, Tepper, March 2011, Wiley & Sons
[9] Capital Group – American Funds, https://www.capitalgroup.com/advisor/tools/guide-to-market-volatility/articles/what-past-market-declines-teach-us.html
[10] J.P. Morgan, https://www.jpmorgan.com/wealth-management/wealth-partners/insights/the-bear-necessities
DISCLOSURES
Information provided in this article is general in nature, is provided for informational purposes only, and should not be construed as investment advice. These materials do not constitute an offer or recommendation to buy or sell securities. The views expressed by the author are based upon the data available at the time the article was written. Any such views are subject to change at any time based on market or other conditions. Clearstead disclaims any liability for any direct or incidental loss incurred by applying any of the information in this article. All investment decisions must be evaluated as to whether it is consistent with your investment objectives, risk tolerance, and financial situation. You should consult with an investment professional before making any investment decision.
Performance data shown represents past performance. Past performance is not indicative of future results. Current performance data may be lower or higher than the performance data presented
YOUR FUTURE IN FOCUS
At Clearstead, we create integrated, prudent, and custom strategies that bring clarity to you or your organization’s financial future.
Clearstead is an independent financial advisory firm serving wealthy families and leading institutions across the country. As a fiduciary, it provides wealth management services and investment consulting to help clients meet their financial objectives, achieve their aspirations, and build stronger futures.
SERVICES
INSIGHTS
CONTACT US
1100 Superior Avenue East
Suite 700 | Cleveland, Ohio 44114
216-621-1090
FOLLOW US